DAAC Home > Resources > News

News

ABoVE

Landscape-Scale Estimates of Methane Ebullition from Lakes

Submitted by ORNL DAAC Staff on
Image Media
Image Media
Caption

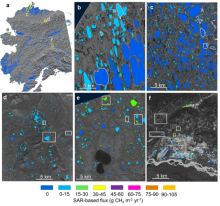
SAR-based lake ebullition maps. Panel a shows Alaska study regions with SAR footprints outlined in yellow. Subsequent panels show SAR-based CH4 ebullition maps for b) Barrow Peninsula, c) Atqasuk, d) Toolik, e) northern Seward Peninsula, and f) Fairbanks. Study lakes with field-based measurements are outlined (b,c) or boxed (d,e,f) in white. Orange boxes in panel f indicate anthropogenic study lakes.

Body

Synthetic Aperture Radar (SAR) was used to estimate methane ebullition flux for thousands of lakes in five regions across Alaska.

Carbon Combustion Following Saskatchewan Wildfires

Submitted by ORNL DAAC Staff on
Image Media
Image Media
Caption

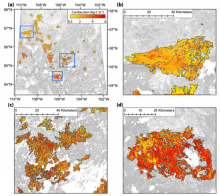
Spatial estimates of total carbon combustion at 30 m resolution across the 2015 fire perimeters in Saskatchewan (a) and sampled fires (b, c, d). The spatial extents of sampled fires are shown as blue rectangles in (a).

Body

A new Arctic-Boreal Vulnerability Experiment (ABoVE) provides spatial estimates of carbon combustion and uncertainty on a 30 m grid.

Soil Pit Properties from the Arctic-Boreal Vulnerability Experiment

Submitted by ORNL DAAC Staff on
Image Media
Image Media
Caption

Site sampling plan used for characterizing active layer soils (left). Axes are in meters. At Imnavait Creek, active layer thickness (ALT) was measured on transects intersecting a central soil pit. Soil dielectric properties, in situ moisture and temperature profiles were measured, and soil samples were collected for analyses from the soil pit (right).

Body

Active layer thickness, soil dielectric profiles, and soil physical properties are key variables for understanding the Arctic permafrost layer.

Soil Temperature Profiles Characterize Permafrost at USArray Sites

Submitted by ORNL DAAC Staff on
Image Media
Image Media
Caption

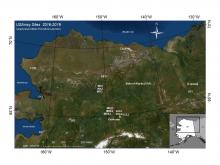
Sixteen measurement sites located across interior Alaska, USA, and at one site in Yukon, Canada. Sites C17K, C26K, E23, F17, H31, and I17 are collocated with the seismic stations.

Body

New soil temperature profile measurements collected at USArray stations are available from the Arctic-Boreal Vulnerability Experiment (ABoVE).

High Res/Cloud-Free Snow Cover Extent and Depth

Submitted by ORNL DAAC Staff on
Image Media
Image Media
Caption

Downscaled MERRA-2 snow depth (in meters) data. Images show snow depth for two time periods: spring snow melt for 23-30 April, 2007 (left) and during early snow accumulation for 30 September-7 October, 2007 (right).

Body

One kilometer resolution, cloud-free snow cover extent and snow depth data are available for Alaska from 2001 to 2017.

Spatial Patterns in Methane Fluxes of Arctic Vegetation

Submitted by ORNL DAAC Staff on
Image Media
Image Media
Caption

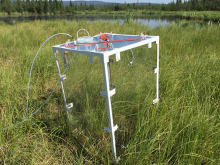
The custom-built chamber for measuring in situ trace gas fluxes from soil/vegetation and water surfaces. The chamber (~ 0.5 m3) provides adequate height to enclose emergent grasses and reeds.

Body

A new dataset provides diffusive methane (CH4) fluxes of emergent and upland vegetation at two thermokarst lakes in Alaska.

Surveying the Ecological Effects of Fire on Alaska's Yukon-Kuskokwim Delta

Submitted by ORNL DAAC Staff on
Image Media
Image Media
Caption

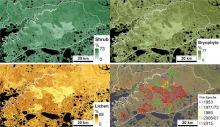
Vegetation point-intercept (VPI) any-hit cover metric data were combined with Landsat imagery to develop fractional maps of any-hit cover for four aggregated plant functional types (PFTs);  shrubs bryophytes, lichen, and herbs for the upland tundra area of the Y-K Delta, Alaska. VPI data were collected from plots in areas burned in 1971, 1985, 2005, and 2015.

Body

Ecological field data and maps of vegetation cover spanning gradients of fire history in upland tundra are available from the Arctic-Boreal Vulnerability Experiment (ABoVE).

Boreal Forest Biomass and Soil Metrics at Burned Sites

Submitted by ORNL DAAC Staff on
Image Media
Image Media
Caption

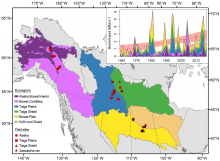
Field sites, ecoregions, and total area burned (millions of hectares; Mha) in each of the ecoregions in the study domain over time. Grey dotted line in the inset represents the simple linear regression, with red shading for the 95% confidence intervals, of burned area for all ecoregions combined. Analyses were completed using the field site groupings, located within the six ecoregions defined by the EPA Level II Ecoregions of North America.

Body

Burned forest plot data is available from the Arctic-Boreal Vulnerability Experiment (ABoVE).

Active Layer Thickness across Alaska

Submitted by ORNL DAAC Staff on
Image Media
Image Media
Caption

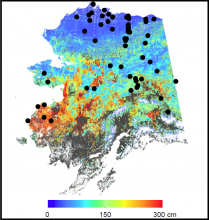
Model-simulated 1 km mean active layer thickness (ALT) map from 2001 to 2015. Black dots are locations of circumpolar active layer monitoring (CALM) sites used for comparison of observed ALT to modeled ALT. CALM data are not provided. The areas with ALT greater than 300 cm depth are shown in dark gray.

Body

MODIS and SMAP satellite data were used to derive estimates of active layer thickness and uncertainty.

Open Water Masks from AirSWOT Flight Paths over Alaska

Submitted by ORNL DAAC Staff on
Image Media
Image Media
Caption

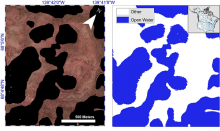
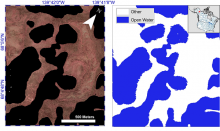
Example of color-infrared imagery shown alongside the corresponding semi-automated open water classification at Old Crow Flats, Alaska.

Body

Over 3,000 km2 of open surface water were mapped from AirSWOT flight lines made in Summer 2017 for the Arctic-Boreal Vulnerability Experiment (ABoVE).