Body
Fire history and field measurements were used to estimate above- and belowground carbon values.

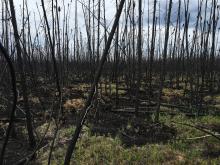
A typical burned plot in the Saskatchewan, Canada, boreal forest study area.
Fire history and field measurements were used to estimate above- and belowground carbon values.

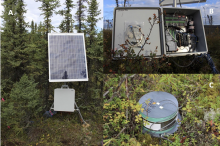
(A) A Soil Respiration Station (SRS), (B) a SRS data logger, and (C) a Forced Diffusion Chamber (FD chamber) deployed at a boreal forest site in central Alaska.
Data collected by soil respiration stations installed at boreal and tundra sites are available from the Arctic-Boreal Vulnerability Experiment (ABoVE).

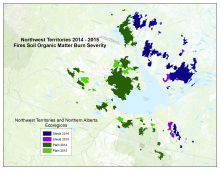
Study area included sites burned in 2014 and 2015 in the southeastern portion of the Northwest Territories and northern Alberta of Canada. The study area includes all 2014 and 2015 fires within a radius of approximately 300 km from Great Slave Lake.
Pre- and post-fire Landsat images were used to classify burn severity of soil organic matter across portions of arctic Canada.

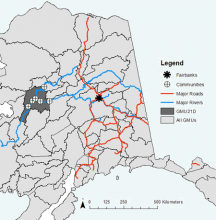
Map of study area communities. GMUs are Game Management Units and GMU21D is highlighted.
Environmental conditions during moose hunting season for 2000-2016 are available for rural Alaska.

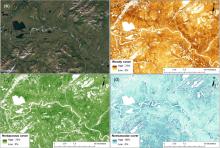
Examples of fractional cover distribution in a tundra region near Lake Narvakrak in the Noatak River National Preserve: (a) very high-resolution imagery from Google Earth; (b) fractional cover of woody component; (b) fractional cover of herbaceous component; (d) fractional cover of nonvascular component.
Maps of three major wildland fire fuel types are available from the Arctic-Boreal Vulnerability Experiment.

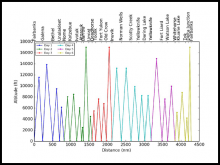
Arctic-CAP flights consisted of vertical profile maneuvers from near the surface to 6 km altitude around the ABoVE domain each month. Profiles were flown at each of the 25 locations listed across the top of this figure.
Atmospheric gas concentrations collected during the Arctic Carbon Aircraft Profile (Arctic-CAP) campaigns are now available.

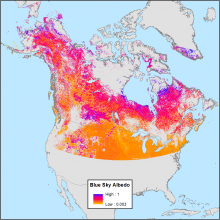
Daily mean shortwave blue sky albedo for February 28, 2000. Blue sky refers to albedo calculated under real-world conditions with a combination of both diffuse and direct lighting based on atmospheric and view-geometry conditions.
Daily “blue sky” shortwave albedo data were derived from the MODIS bi-directional reflectance distribution function.

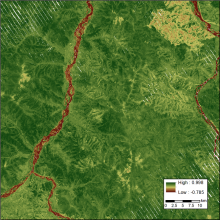
Peak greenness derived from the Normalized Difference Vegetation Index (NDVI) for the year 2010 in the ABoVE grid cell Bh07v07.
Maps of annual seasonality and greenness are now available from the Arctic-Boreal Vulnerability Experiment.

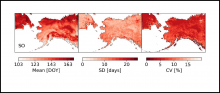
Summary statistics for the snowoff date from 1988-2016 across the study domain: mean (left), standard deviation (middle), and coefficient of variation (right).
Snowoff dates, detected by passive microwave, are available across Alaska, northwestern Canada, and the Russian Far East.

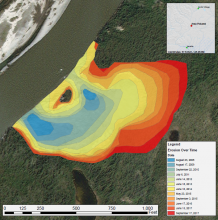
Annual expansion of a thaw slump on the East Fork Chandalar River near the community of Venetie, Alaska, from 2008 through 2017. The erosion time series was created by digitizing data from ESRI base maps and Landsat 5, 7, and 8 images. The eroded area appears to be growing steadily, mostly to the east, with apparent limitation on growth to the north and south.
A time series of Landsat-derived maps shows the expansion of a thaw slump in Alaska.
