Body
L1B orthocorrected, scaled radiance image files as well as files of observational geometry and illumination parameters and supporting sensor band information from the AVIRIS-Classic instrument.

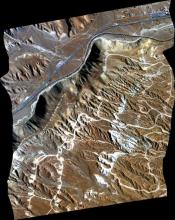
RGB composite image from AVIRIS-Classic flightline f170628t01p00r04 acquired on June 28 2017 northwest of Mojave, California.

Banner for NASA workshop "An Introduction to Working with NASA Remote Sensing Data in the Cloud Using Open Source Software" being held during the Ecological Society of America's 2023 meeting.
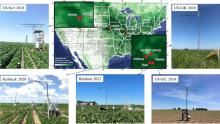
Field sites for ground measurements of solar-induced fluorescence with examples of FluoSpec2 systems.
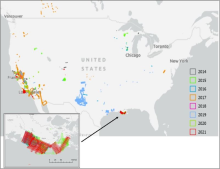
Location of AVIRIS-NG flight lines in conterminous US for 2014 - 2021. Inset shows detail of flight lines in coastal Louisiana associated with the Delta-X project.
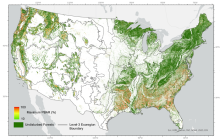
Forest disturbance intensity 1986 - 2015. This time-integrated map represents the percentage of basal area removal (PBAR) value, regardless of the disturbance year, for pixel locations where only one disturbance event was detected. The maximum PBAR is shown for locations that were disturbed multiple times.
Portion of quick look image for flight ang20200907t214229 on 07 September 2020 over the Russian River in Sonoma County south of Cloverdale, California (approximately 38.7392 lat, -122.9387 lon). Source: ancillary file ang20200907t214229_geo.jpg
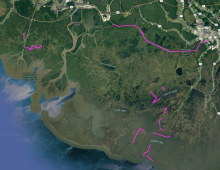
Map of boat survey areas during the Fall 2021 Delta-X campaign.
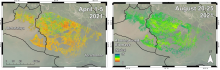
Herbaceous aboveground biomass (megagrams/hectare) product for the Atchafalaya and Terrebonne Basins, coastal Louisiana, derived from AVIRIS-NG data collected during the April and August 2021.
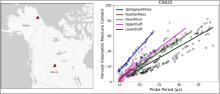
Location of sites in Alaska, U.S., and Alberta, Canada (left, red triangles) and calibration plot (right) for the Campbell Scientific CS625 soil moisture sensor and five types of organic soils.
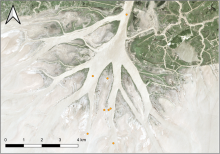
Suspended and bed sediment sampling locations in the Wax Lake Delta, Louisiana. Clusters of measurements are grouped together into single points on this map. Map excludes measurements made far upstream of the Wax Lake Delta or in the Terrebonne River Basin.