Body
Observations collected during 11 airborne campaigns from 2006–2017 and associated input and output from 9 widely used CTMs.

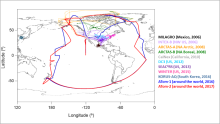
Flight tracks for airborne campaigns in this dataset.
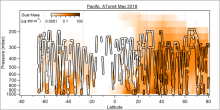
Dust mass observations across the Pacific Ocean made by the PALMS instrument combined with AMP aerosol size spectrometers during the ATom-4 campaign in May 2018.
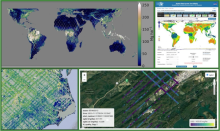
A set of example visualizations for GEDI mission data products.
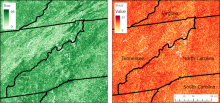
Percent cover of trees (left) and shrubs (right) in 2018 for the southern Appalachian mountains of Tennessee, Virginia, North Carolina, and South Carolina. Areas shown cover four tiles.
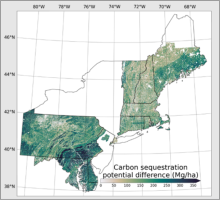
Spatial patterns of forest carbon stores and carbon sequestration potential for the Regional Greenhouse Gas Initiative domain. Map shows carbon sequestration potential difference.
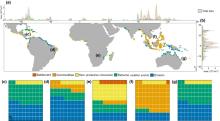
Global distribution of mangrove loss and its drivers. (a) The longitudinal distribution of total mangrove loss and the relative contribution of its primary drivers. Different colors represent unique drivers of mangrove loss. (b) The latitudinal distribution of total mangrove loss and the relative contribution of its primary drivers. (c-g) Global distribution of mangrove loss and associated drivers from 2000 to 2016 at 1-degree x 1-degree resolution, with the relative contribution (percentage) of primary drivers per continent: (c) North America, (d) South America, (e) Africa, (f) Asia, (g) Australia together with Oceania.
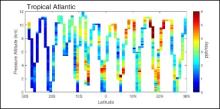
Curtain plot for production of ozone from the ATom-1 campaign in the Atlantic. The 10 s air parcels are averaged into 10-degree latitude and 200 m altitude bins. Reactivities, such as P-O3, are calculated for each 10 s air parcel from the Modeling Data Stream (MDS), Version 2, using the UC Irvine chemistry-transport model (CTM) with HNO4 and PAN damped by thermal decomposition.
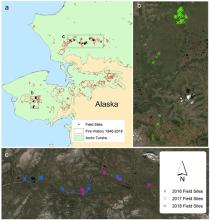
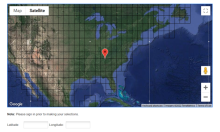
Locations of field sites in Alaska, U.S.
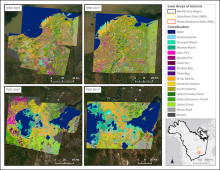
Classified wetland type maps for the Slave River Delta (SRD) and Peace-Athabasca Delta (PAD), Canada circa 2007 and circa 2017.