Body
Annual estimates of six carbon pools across the conterminous United States for 2005, 2010, 2015, 2016, and 2017.

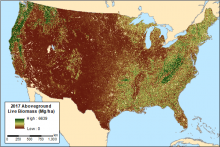
Figure 1. Aboveground live biomass across CONUS for the year 2017 derived from the MaxEnt model.
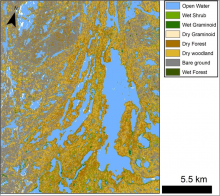
Figure 1. A preliminary wetland classification for Canadian Shield lakes north of Yellowknife, NWT, Canada. Missing data in some lakes appear as white spots
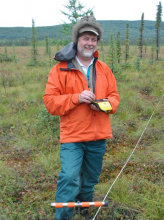
Dr. Kevin Schaefer, Measures a survey location with a high-precision GPS unit near Fairbanks, Alaska in 2018. Image Credit: Roger Michaelides
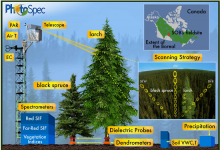
Diagram of the field set-up. This dataset provides the products collected using PhotoSpec mounted at the top of the tower. Measurements collected from other instrumentation shown are not provided in this dataset. Source: Pierrat et al., 2021
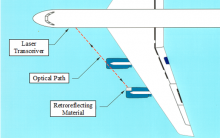
Figure 1. Location of external path DLH on DC-8 (typical port-side installation).
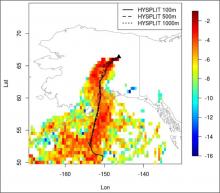
Subset of STILT footprint domain showing contributions overlain by HYSPLIT trajectories from receptors located at 100 (solid), 500 (dashed), and 1,000 m (dotted) at 19:35 UTC 2012-08-20.
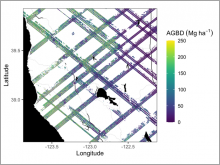
Example subset of aboveground biomass density (AGBD; Mg ha-1) predictions from the GEDI Level-4A footprint product over Northern California, U.S., spanning April to July 2019. GEDI footprints are spaced 60m along-track and 600m across-track.
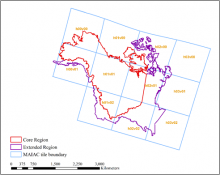
MAIAC tiles (blue squares with yellow labels) and ABoVE core (red) and extended (purple) domain boundaries covering Alaska and western Canada. Source: adapted from Yu et al. 2021
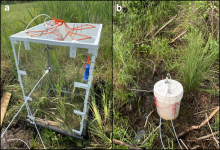
Chambers used to measure diffusive CH4 fluxes. a) Large chamber resting on the pre-installed aluminum collar, sealed on edges with pipe insulation. b) Five-gallon (18.9-liter) bucket with an open bottom and air-tight screw lid to measure hotspot flux locations.
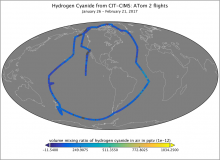
Figure 1. Measurements of Hydrogen Cyanide from the CIT-CIMS instrument collected during ATom-2 flights.