Body
Calendar year 2021 data are now available in Daymet Version 4 datasets.

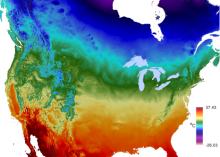
Average maximum temperature for a 24-hour period over an annual period.
This screen capture from the GEDI L4B mean aboveground biomass density layer shows the crisscross pattern of GEDI's laser tracks on the Earth's terrestrial surface.
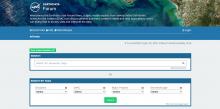
A screenshot of the NASA Earthdata Forum landing page.

Transitioning from MODIS to VIIRS to ensure data product continuity. Image Credit: NASA ESDIS Outreach Team.
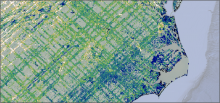
Casual agents of disturbance for the year 2006 in the ABoVE domain for tile BH19V15 (A) with the Tasseled Cap change (dTC) image in the same year for the same region (B). In the dTC image, Band_1 is change in brightness; Band_2 is change in greenness; Band_3 is change in wetness. The pixel resolution is 30 meters.
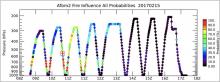
Fire influences for air parcels on the ATom-2 research flight that occurred on 2017-02-15.
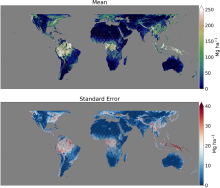
Gridded mean aboveground biomass density (top) and standard error of the mean (bottom).
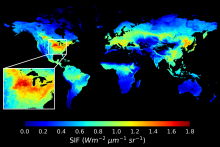
Global map of daily mean Solar Induced Fluorescence (SIF) for July 2010 at 0.05 degree resolution. The USA's Corn Belt (insert) showed the largest SIF emission during the growing Season (Image Credit: Jiaming Wen 2022).
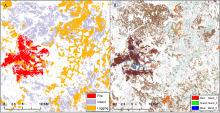
ORNL DAAC Website Search Tool snapshot with example search results.
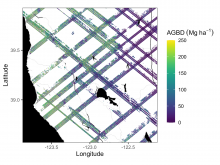
Example subset of aboveground biomass density (AGBD; Mg ha-1) predictions from the GEDI Level-4A footprint version 2.1 product over Northern California, USA, spanning April to July 2019. GEDI footprints are spaced 60m along track and 600m across-track.