Body
Global aboveground and belowground biomass carbon density maps cited by Washington Post article on the Amazon, entitled "Devouring the Rainforest".


The Washington Post is an American daily newspaper founded in 1877 and published in Washington, D.C. with a large international audience.
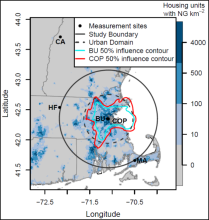
Map of measurement stations in the Boston network. The black line demarcates the 90 km radius circle in which emissions were optimized and the dashed line bounds the urban domain for study. The blue shading represents the number of housing units with natural gas per square kilometer. The red and blue contour encloses 50% of the average footprint initiated at the COP and BU sites, respectively.
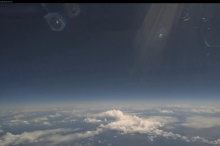
View from the front of the NASA DC-8 aircraft during the ATom-1 campaign.
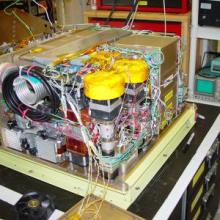
Photo of the interior of the PANTHER GC. This instrument was used during all ATom campaigns.
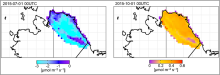
TVPRM net ecosystem exchange: Surface upward mass flux of carbon dioxide expressed as carbon due to emissions from natural sources for 2015-07-01 (left) and 2015-10-01 (right).
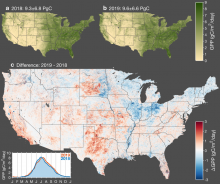
Interannual variation in gross primary productivity (GPP) across conterminous United States. Map of annual mean GPP for 2018 (a) and 2019 (b). Map of the difference in annual mean GPP between 2019 and 2018 (c) wherein red indicates higher GPP in 2019 and blue indicates higher GPP in 2018. The inset in the bottom left corner shows a time series of the average GPP across CONUS for 2018 and 2019.
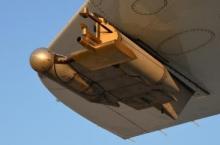
The CAPS instrument attached to the exterior of the NASA DC-8 aircraft.
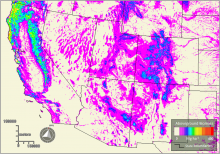
Generalized 2005 MISR-derived AGB map for the southwestern U.S., one in the series for 2000-2021.
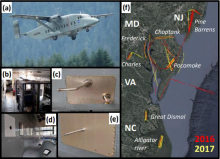
The CARAFE payload. (a) The NASA C-23 Sherpa. (b) A view inside the cabin with all instruments installed. (c) The angle-of-attack (upper) and total air temperature (lower) probes. (d) The DLH window plate (upper left) and fairing-mounted target (lower right). (e) GHG inlet. (f) Flux leg flight tracks for both campaigns.

NASA's GEDI observable is the lidar waveform, all products are derived from it.