Body
NASA's ARSET program has opened a new open, online webinar series to be held on August 23, 25, & 30, 2022 at 11:00-12:30 EDT.


Banner image announcing the ARSET Evaluating Ecosystem Services with Remote Sensing
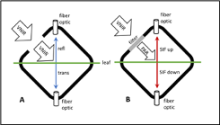
Schematic of FluoWat leaf clip operation for measuring leaf reflectance, transmittance, and upward and downward fluorescence (SIF). The leaf is placed in the clip and illuminated through the open port (A). Reflected and transmitted radiance are measured by attaching a fiber optic cable from the spectrometer to the top or bottom of the clip. To measure fluorescence spectra a low pass filter is placed across the illumination port (B). Two filters are applied in sequence, they block incident wavelengths above 650 nm and 700 nm, therefore any radiance measured in the longer wavelengths can come only from fluorescence.
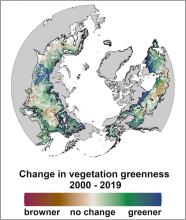
Change in greenness of boreal forest across the northern hemisphere between 2000 to 2019, estimated from an ensemble of vegetation indices derived from Landsat imagery.
Themes of the FIREX-AQ program. Source: https://csl.noaa.gov/projects/firex-aq/about/
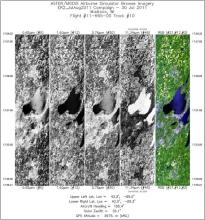
Single band images and an RGB composite image from flight track 10 acquired on 30 July 2011 over Madison, Wisconsin, U.S. Source: MASTERL1B_1166500_01_20110730_1520_1528_V01.jpg
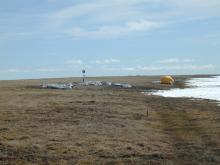
International Tundra EXperiment (ITEX) Barrow study site.
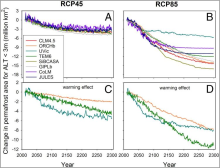
Changes in simulated permafrost dynamics. Simulated cumulative changes in (A and B) permafrost area for active layer thickness (ALT) less than 3 m from 2010-2299 and (C and D) the sensitivity of simulated changes in permafrost area to changes in mean annual air temperature for RCP4.5 (left column) and RCP8.5 (right column) model projections.
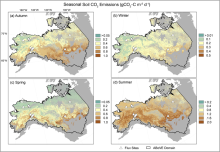
Seasonal average soil respiration emissions (gCO2 C m-2 d-1) for autumn (September-October), winter (November-March), spring (April-May), and summer (June-August ) at a 300 m spatial resolution.
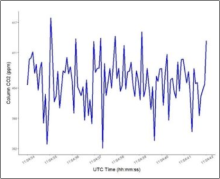
A sample of column CO2 concentrations retrieved on May 27, 2016, over eastern North Carolina.
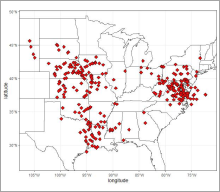
Locations of ACT-America flights collecting MFLL carbon dioxide (CO2) measurements over eastern and central U.S. in 2016-2018.