Body
Global gridded information on lake surface area and open water CH4 emissions for an annual climatology representative of the average conditions from 2003 to 2015.

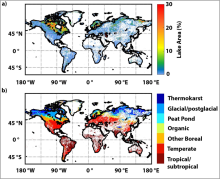
a) Lake area density (fraction of cell area) and b) ecoclimatic lake type classification. White space indicates cells with no lakes present.
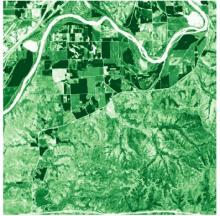
EVI amplitude at Konza Prairie Biological Station in 2019.
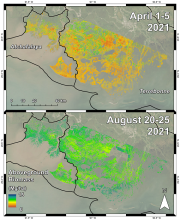
Herbaceous aboveground biomass (megagrams/hectare) product for the Atchafalaya and Terrebonne Basins derived from AVIRIS-NG data collected during the April and August 2021 campaigns.
Picture of the Earthdata Forum landing page.
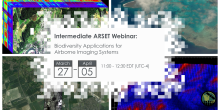
Invitation to participate in NASA's ARSET online webinar series: Biodiversity Applications for Airborne Imaging Systems.
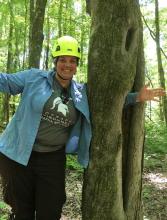
Dr. Kyla Dahlin enjoys some field work near the NEON flux tower on the property of the Oak Ridge National Laboratory in Tennessee. Dahlin is also a member of the ORNL DAAC’s User Working Group (UWG), which supports the DAAC by recommending dataset acquisitions, developing value-added products, and enhancing user support. Credit: Aaron Kamoske.
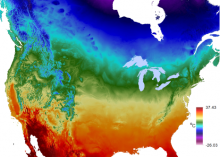
Map of mixing layer height across the sampling area. Source: 20190617_MixedLayerHeight_map.png
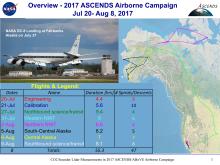
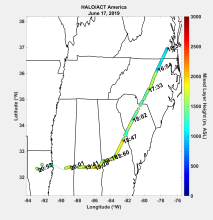
A map showing the ground tracks for the airborne campaign with a table summarizing each flight. The colors in the table match those shown in the ground tracks. Image is from the related dataset Abshire et al. (2022).
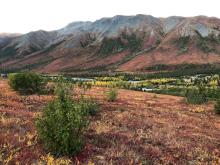
Alder shrubs expanding into graminoid tundra. Coldfoot Valley, Alaska. 2019.