Body
Global salt marsh change, including loss and gain for five-year periods from 2000-2019.

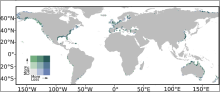
Global salt marsh change represented in a bivariate color scheme.
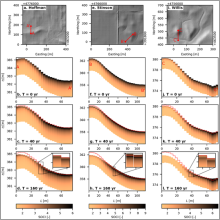
Hillslope transects at three sites showing redistribution of soil organic carbon (SOC) simulated over 160 years in Iowa. Sites (columns): Hoffman, Stinson, and Willis. Upper row shows hillshade maps illustrating topography at each site. Red lines show location of transects proceeding from upslope to downslope (e.g., A to A'). Lower three rows illustrate pattern of SOC along the transect distance (L) at soil depths at beginning of simulation (0 y), after 40 y, and at end of simulation (160 y). Red lines indicate the initial surface elevation at beginning of simulation. Insets highlight cases where soil with low SOC blankets soil with higher SOC.
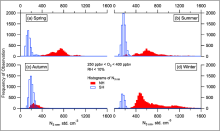
Histograms of the total number of aerosols between 3 and 4500 nm in the LMS (ozone 250-400 ppbv, altitude > 8 km) for the SH and NH) for all ATom deployments (a-d), by season. Modified from fig. 2 of Williamson et al. (2021).
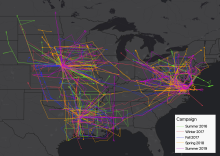
Flight paths for five airborne campaigns of ACT-America that provided receptor locations and CO2 measurements for these FLEXPART simulations. Flights were concentrated on three study areas: the northeast, south-central, and mid-west regions of the United States.
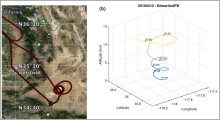
(a) Flight track for 10 February 2016 flight over Edwards AFB, California. (b) Time-tagged location and altitude plot for the spiral-down maneuver over Edwards AFB for the same flight (Abshire et al., 2018).
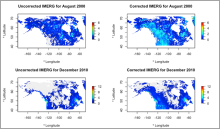
Two examples of uncorrected and corrected months Canada-Alaska domain. The correction is applied to pixels > 500 m, so the correction is seen primarily in mountainous areas. Figure from Lober et al. (in review).
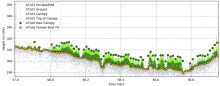
ATL08 data visualized along-track (100m step size), showing the estimated ground elevation, estimated canopy top height, and the individual photon return heights with their classifications. Image credit: Amy Neuenschwander, Center for Space Research, University of Texas.
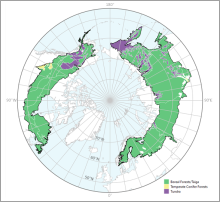
Tree canopy cover over global boreal forests in 2020.
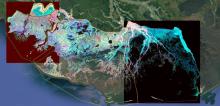
RGB composite image of the Atchafalaya and Terrebonne basins (R=Bathymetry, G=NIR of 1st quarter, B=NIR of 3rd quarter) highlighting the various ecological and geomorphological features of the landscape.
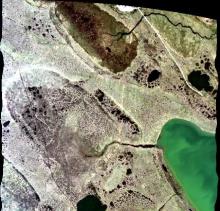
A portion of the quicklook image from flight line ang20170714t212855 over Barrow, Alaska on July 14, 2017. Two sites (AB_B10_L001_FL175_PipelineLake and AB_B10_L003_FL175_PipelineLake) of interest to the ABoVE project are visible. Flight altitude was approximately 5,400 m with very thin cirrus cloud cover.