Body
Ozone measurements from the Ozonesonde instrument in Antarctica, Hawaii, and Fiji taken during the Atom-4 campaign.

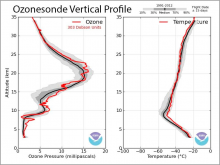
Example of a vertical profile created from Ozonesonde and radiosonde instruments. Source: https://gml.noaa.gov/ozwv/ozsondes
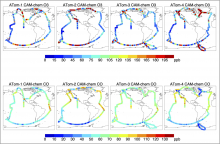
CAM-chem simulated concentrations of ozone (O3) and carbon monoxide (CO) along ATom flight tracks.
Snapshots from select NASA field and airborne campaigns.
This online workshop is an opportunity for stakeholders to provide input on ways to improve the usability of NASA airborne and field data.
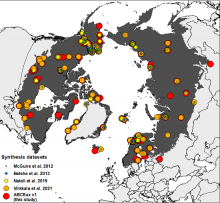
The flux site distribution in syntheses focused on compiling fluxes from high latitudes (McGuire et al. 2012, Belshe et al. 2013, Natali et al. 2019, Virkkala et al. 2021 and this study (ABCflux)). The Arctic-Boreal Zone is highlighted in dark grey; countries are shown in the background. Based on the unique latitude-longitude coordinate combinations in the tundra, there were 136 tundra sites in ABCflux, 104 tundra sites in Virkkala et al. 2021, 68 tundra sites in Natali et al., 2019, 34 tundra sites in Belshe et al. 2013, and 66 tundra sites in McGuire et al., 2012. Observations that were included in previous studies but not in ABCflux represent fluxes aggregated over seasonal, not monthly periods.
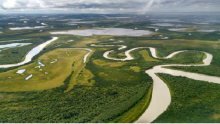
Aerial view of the Yukon Delta landscape near the village of Emmonak, August 2017
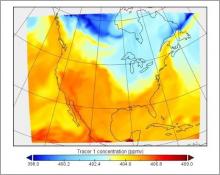
Simulated tracer 1 concentrations (ppmv) in vertical level 5 on 2016-06-29 at 12:00 pm. Output from WRF-Chem (v. 3.6.1) model.
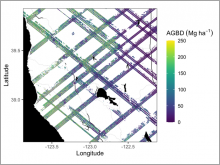
Example subset of aboveground biomass density (AGBD; Mg ha-1) predictions from the GEDI Level-4A footprint product over Northern California, U.S., spanning April to July 2019. GEDI footprints are spaced 60m along-track and 600m across-track.
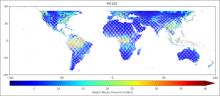
Level 3 estimated canopy height in meters derived from the Level 2 profile metric RH100 between the 19th and the 122nd mission week.
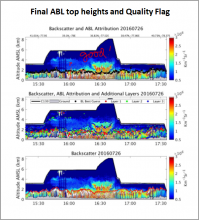
Top: Annotated time-height cross-section of aerosol backscatter profiles measured using CPL onboard C-130 aircraft on 2016-07-26. Wavelet-derived ABL top (black solid-circles) height overlaid. Middle: Secondary aerosol layers overlaid on the top panel. Bottom: Final attributed ABL top heights.
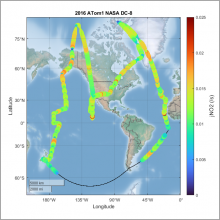
CAFS derived total NO2 photolysis frequencies (jNO2) during ATom 1. The flight track (black line) is shown during nighttime operations when jNO2 is below detection limits.