Body
A new dataset from the Atmospheric Tomography Mission compiles measurements of mean age of air.

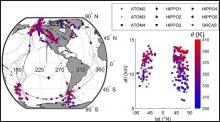
Horizontal (left) and vertical (right) distribution of airborne flask sample locations identified as being of stratospheric origin. Thin dashed black lines on the map illustrate the flight tracks of all 9 campaigns of the 3 airborne projects. Symbols indicate the campaigns during which the stratospheric samples were collected, and colors show the potential temperature at which the sample was taken.
A new dataset from the Atmospheric Tomography Mission compiles measurements of mean age of air.
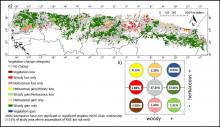
Concurrent woody and herbaceous vegetation changes between the 1982-1991 and 2004-2013 decades of the Sudano-Sahel region of Africa. (A) Map of vegetation change categories. (B) Chart showing the conceptual position and the relative abundance of each category in a 2-D space.
Vegetation change data spanning the West African Sudano-Sahel region is now available.
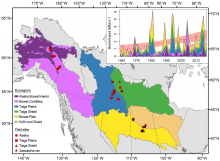
Field sites, ecoregions, and total area burned (millions of hectares; Mha) in each of the ecoregions in the study domain over time. Grey dotted line in the inset represents the simple linear regression, with red shading for the 95% confidence intervals, of burned area for all ecoregions combined. Analyses were completed using the field site groupings, located within the six ecoregions defined by the EPA Level II Ecoregions of North America.
Burned forest plot data is available from the Arctic-Boreal Vulnerability Experiment (ABoVE).
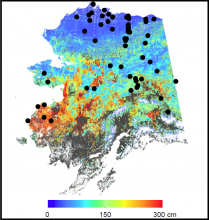
Model-simulated 1 km mean active layer thickness (ALT) map from 2001 to 2015. Black dots are locations of circumpolar active layer monitoring (CALM) sites used for comparison of observed ALT to modeled ALT. CALM data are not provided. The areas with ALT greater than 300 cm depth are shown in dark gray.
MODIS and SMAP satellite data were used to derive estimates of active layer thickness and uncertainty.

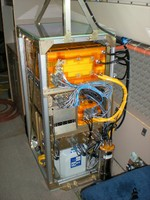
The SAGA installation onboard the DC-8 - AFRC aircraft.
Soluble ion measurements are available from the Atmospheric Tomography Mission (ATom).
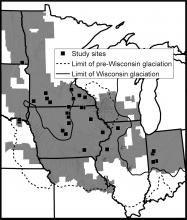
Study area in the Midwestern US with study site locations and extent of analysis. The study area was limited to the spatial extent of LiDAR topographic data (gray hillshade). Squares represent the 28 sites, a total of 210 km2, that were selected for having plowed, bare soil.
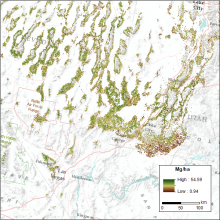
Maps of live tree biomass in pinyon-juniper forests are available for the years 2000-2016.
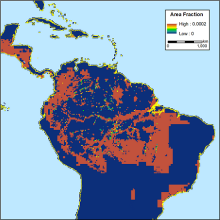
Annual estimates of fractional land use and cover patterns are available for the period 2015 to 2100.
Responsive design with multiple products and site ordering features now available in Global Subsets Tool for MODIS/VIIRS Land Products.
The Harvard QCLS (DUAL and CO2) instrument package contains 2 separate optical assemblies and calibration systems, and a common data system and power supply.
The QCLS instrument package was used to measure atmospheric concentrations.