Body
Level 1 and 2 high-resolution, laser altimetry data from the Global Ecosystem Dynamics Investigation (GEDI) are now available from the LP DAAC.

GEDI data will help further refine our understanding of the carbon cycle and atmospheric concentrations of carbon dioxide (CO2).
Level 1 and 2 high-resolution, laser altimetry data from the Global Ecosystem Dynamics Investigation (GEDI) are now available from the LP DAAC.
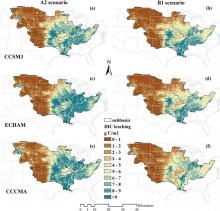
Spatial distribution of mean dissolved inorganic carbon (DIC) leaching (g c/m2/yr) in the 2090s estimated by S(ALL) simulation experiment (including future climate, elevated CO2, and land use changes). Climate change scenarios were derived from three climate models named CCSM3 (panels a and b), ECHAM (c and d), and CCCMA (e and f) under high (A2) and low (B1) emission scenarios, respectively.
New data from the Carbon Monitoring System (CMS) offers insights into how environmental factors affect the dynamics of leaching.

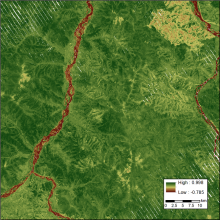
Peak greenness derived from the Normalized Difference Vegetation Index (NDVI) for the year 2010 in the ABoVE grid cell Bh07v07.
Maps of annual seasonality and greenness are now available from the Arctic-Boreal Vulnerability Experiment.

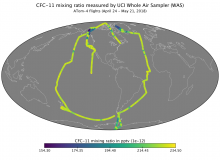
Mixing ratio of CFC-11 measured by Whole Air Sampler (WAS) during ATom-4 flights in April-May 2018.
The UC-Irvine Whole Air Sampler (WAS) instrument was used during the Atmospheric Tomography (ATom) mission.
, April-May 2018.")
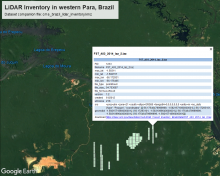
Bounding boxes for LiDAR tiles from surveys over western Para, Brazil, are depicted in Google Earth from the KMZ companion file. Each feature in the KMZ provides key metadata about the corresponding tile.
LiDAR surveys over forest research sites across the Amazon rainforest in Brazil are available.

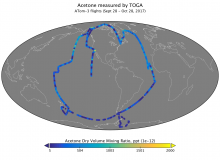
Measurements of atmospheric acetone concentration from samples collected by the Trace Organic Gas Analyzer (TOGA) during ATom-3 flights in 2017.
Concentrations of volatile organic compounds (VOCs), measured by the Trace Organic Gas Analyzer (TOGA), are available.

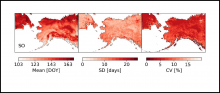
Summary statistics for the snowoff date from 1988-2016 across the study domain: mean (left), standard deviation (middle), and coefficient of variation (right).
Snowoff dates, detected by passive microwave, are available across Alaska, northwestern Canada, and the Russian Far East.

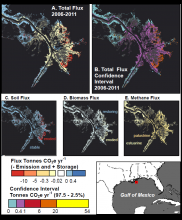
Estimated CO2e fluxes and confidence interval ranges for the Mississippi River outlet in Louisiana, United States. This area contains palustrine and estuarine wetlands, and includes stable wetlands, wetland gains and loss events from 2006 to 2011. A: Total flux from 2006 to 2011. B. Uncertainty, as represented by confidence interval range (0.975 - 0.025 quantile distributions of the results of the Monte Carlo Analysis). C-E. The relative contributions of soil, biomass, and methane to the total flux (A).
A new dataset provides maps of surface elevation, land cover, biomass, and estimated coastal wetland carbon fluxes.

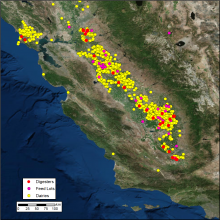
Vista-CA provides locations of methane (CH4) emitting facilities and infrastructure in the State of California. In this figure, the distribution of digesters, feed lots, and dairies across the San Francisco Bay Area and Central Valley are shown.
The Vista-CA dataset provides locations of potential methane (CH4) emitting facilities and infrastructure across the state of California.

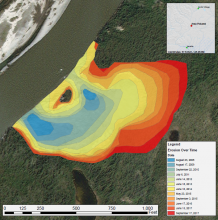
Annual expansion of a thaw slump on the East Fork Chandalar River near the community of Venetie, Alaska, from 2008 through 2017. The erosion time series was created by digitizing data from ESRI base maps and Landsat 5, 7, and 8 images. The eroded area appears to be growing steadily, mostly to the east, with apparent limitation on growth to the north and south.
A time series of Landsat-derived maps shows the expansion of a thaw slump in Alaska.
