Body
A new dataset provides estimates of CO2 emissions from fossil fuels across California in 2014-2015.

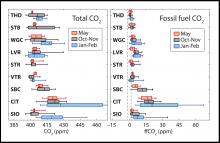
Seasonal quartiles of total CO2 concentrations and fossil fuel CO2 concentrations for each of the nine observation sites in California, 2014-2015.
A new dataset provides estimates of CO2 emissions from fossil fuels across California in 2014-2015.

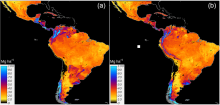
Country-specific (a) and regional (b) predictions of SOC across Latin America based on a linear ensemble of methods.
A new dataset offers baseline estimates of soil organic carbon for Latin American countries.

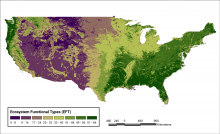
Spatial distribution of 64 ecosystem functional type (EFT) categories across the conterminous United States (CONUS). For each pixel, the dominant EFT is reported.
New data from the Carbon Monitoring System classifies ecosystems based on their similar ecosystem functioning.

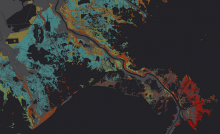
Estimated soil carbon stocks (using model results) throughout the Mississippi River delta in Louisiana. Cooler colors (blues and greens) indicate higher soil carbon concentrations.
Researchers with NASA's Carbon Monitoring System estimated the amount of carbon stored in the soil in tidal wetlands of the United States.

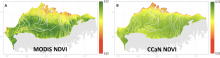
MODIS (left) and CCaN (right) average growing season NDVI.
A new study of long-term NDVI trends across the North Slope of Alaska presents high-resolution growing-season NDVI from MODIS.

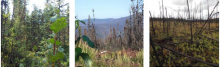
Photos from July 2017 field surveys near Tanana, Alaska, from left to right: unburned forest site; burned forest near the Spicer Creek Fire; high burn severity forest site.
Researchers with NASA's ABoVE field campaign measured burn severity in spruce forests that burned in 2015 near Tanana, Alaska.

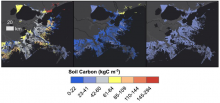
Results of three carbon stock estimation approaches for the Louisiana Delta region: Left, using independently generated soil carbon maps from SSURGO; Middle, using the SSURGO bias-corrected for bulk density; Right, using single average carbon stock value from the compiled soil core data.
Soil carbon stocks for tidal wetland areas of the United States were estimated using four modeling approaches.

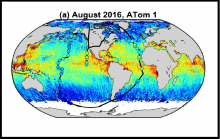
Circles mark the locations of the 139 selected profiles sampling the remote troposphere. Circle color indicates HCHO column densities integrated over each ATom profile. Data are overlain on global gridded OMI HCHO column densities averaged over the mission. From Wolfe et al. (2019) (see dataset references).
New data from NASA's Atmospheric Tomography Mission (ATom) provide hydroxyl and formaldehyde column density in the remote troposphere.

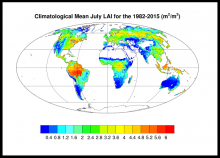
Mean leaf area index for July (calculated over the period 1982-2015).
A global dataset characterizes the long-term (1981-2015) monthly mean Leaf Area Index (LAI) based on AVHRR GIMMS data.

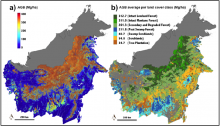
Aboveground biomass (AGB) density maps of Kalimantan forests. (A) AGB density, and (B) mean density AGB aggregated by land cover class. From Ferraz et al., 2018.
A new dataset from the Carbon Monitoring System provides forest biomass, canopy height, and degradation maps across the Indonesian portion of the island of Borneo.
