Body
Aerosol data collected during Atmospheric Tomography Mission (ATom) will inform on new particle formation occurrence in the tropics.


The NASA DC-8 aircraft was used for the ATom missions.
Aerosol data collected during Atmospheric Tomography Mission (ATom) will inform on new particle formation occurrence in the tropics.


NASA's Earth Observing System Data and Information System (EOSDIS) is a key core capability in the Earth Science Data Systems (ESDS) Program.
Solicitations for the 2019 NASA EOSDIS Annual Customer Satisfaction Survey have been distributed by email.
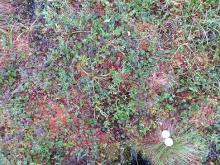
A plot photo (#0656) taken at the largest study area 'Toolik' at elevation 765.7 m. The small white object was included in many of the photos as a color reference. The photographer's boots are also often visible, in this photo they are to the lower left of the white object.
A new ABoVE dataset offers hundreds of ground-based vegetation photos which may serve as a reference for studies of climate and vegetation change in the area.

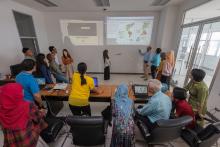
Dr. Don McNeil and his students analyzing data in the classroom. The projected wall image on the left shows the result of a MODIS data subset using the ORNL DAAC's Global Subsets Tool. The projected wall image on the right shows thematic maps of daily land surface temperature increase in North and South America and Antarctica using a laterally rotated Mollweide Earth projection. Image courtesy of Dr. McNeil.
Dr. Don McNeil and students at Prince of Songkla University in Thailand use NASA Earth observing data to study environmental change.

The Atmospheric Tomography (ATom) Mission is an Earth Venture Suborbital-2 mission to measure greenhouse gases and human-produced air pollution in remote areas.
Five new datasets from ATom provide measurements of greenhouse gases and human-produced air pollution from 2016 to 2018.
 Mission")
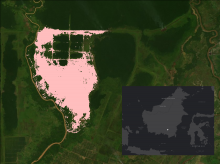
The area burned in 1997 and 1998 in the Mawas area, Central Kalimantan, Indonesia is shown in pink. The inset with white dot shows the location of Mawas study site on the Island of Borneo.
Maps of annual burned area from 1997 to 2015 show the extent of fires in the Mawas region of Central Kalimantan.

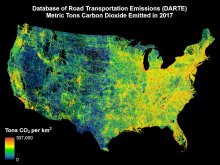
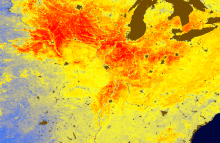
Map of DARTE on-road CO2 emissions for the conterminous United States for the year 2017.
The updated DARTE dataset provides high-resolution, annual, on-road CO2 emissions for the conterminous United States.

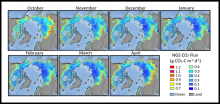
Mean daily soil CO2 flux in each month of the non-growing season (NGS) during the baseline period (2003-2018). Gridded estimates are provided at 25-km resolution for the pan-Arctic and Boreal permafrost region.
New data from the Arctic-Boreal Vulnerability Experiment (ABoVE) provide winter soil CO2 flux estimates for the pan-Arctic and Boreal regions.

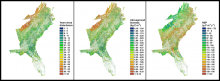
Maps of the number of years since the most recent disturbance, aboveground biomass, and net ecosystem productivity in the year 2010, for forests of the Southeastern USA.
A new Carbon Monitoring System dataset used a carbon cycle process model and historic data to estimate aboveground woody biomass and net ecosystem productivity over time.

Predicted spatially contiguous solar-induced chlorophyll fluorescence (SIF) across the United States for August 1 - 16, 2015. Areas of high SIF are in red, and areas of low SIF are in blue. Agricultural areas, like the U.S. Midwestern corn belt, often have a high rate of photosynthetic production which results in high SIF.
High-resolution, global, estimates of SIF based on data from the OCO-2 satellite serve as a proxy for rates of terrestrial photosynthesis.
 across the United States")