Body
Carbon fluxes and uncertainties are available from the Atmospheric Carbon and Transport - America (ACT-America) project.

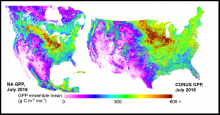
Mean gross primary productivity (GPP) for the conterminous US and North America in grams of carbon per unit area per month.
Carbon fluxes and uncertainties are available from the Atmospheric Carbon and Transport - America (ACT-America) project.

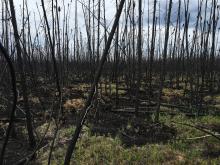
A typical burned plot in the Saskatchewan, Canada, boreal forest study area.
Fire history and field measurements were used to estimate above- and belowground carbon values.

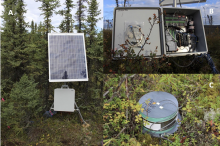
(A) A Soil Respiration Station (SRS), (B) a SRS data logger, and (C) a Forced Diffusion Chamber (FD chamber) deployed at a boreal forest site in central Alaska.
Data collected by soil respiration stations installed at boreal and tundra sites are available from the Arctic-Boreal Vulnerability Experiment (ABoVE).

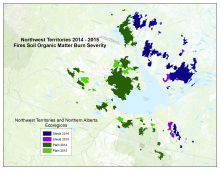
Study area included sites burned in 2014 and 2015 in the southeastern portion of the Northwest Territories and northern Alberta of Canada. The study area includes all 2014 and 2015 fires within a radius of approximately 300 km from Great Slave Lake.
Pre- and post-fire Landsat images were used to classify burn severity of soil organic matter across portions of arctic Canada.

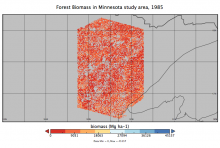
Biomass (Mg ha-1) for the northern Minnesota site.
Six Landsat focus sites were used to produce disturbance history and forest biomass maps.

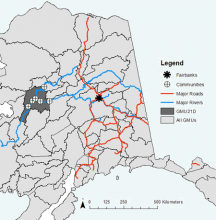
Map of study area communities. GMUs are Game Management Units and GMU21D is highlighted.
Environmental conditions during moose hunting season for 2000-2016 are available for rural Alaska.


Yaxing Wei has been named Lead Scientist of the ORNL DAAC.
Geospatial information scientist, Dr. Yaxing Wei, is the new ORNL DAAC Lead Scientist.

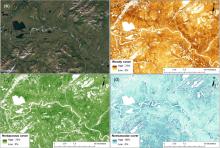
Examples of fractional cover distribution in a tundra region near Lake Narvakrak in the Noatak River National Preserve: (a) very high-resolution imagery from Google Earth; (b) fractional cover of woody component; (b) fractional cover of herbaceous component; (d) fractional cover of nonvascular component.
Maps of three major wildland fire fuel types are available from the Arctic-Boreal Vulnerability Experiment.

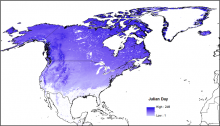
Mean snowmelt Day of Year (DOY) for the years 2001-2018 for North America. The DOY values for snowmelt timing were identified by observing the transition from snow-cover to no-snow for individual MODIS pixels throughout the annual melt period.
The second version of snowmelt timing maps for North America is available for the period 2001 through 2018.

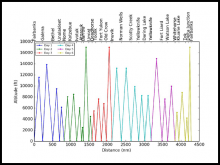
Arctic-CAP flights consisted of vertical profile maneuvers from near the surface to 6 km altitude around the ABoVE domain each month. Profiles were flown at each of the 25 locations listed across the top of this figure.
Atmospheric gas concentrations collected during the Arctic Carbon Aircraft Profile (Arctic-CAP) campaigns are now available.
