Body
Pre-Delta-X Campaign datasets now available: AGB from AVIRIS-NG/UAVSAR, surface reflectance and total suspended solids from AVIRIS-NG.

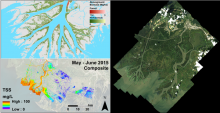
Pre-DeltaX image highlights: AVIRIS-NG/UAVSAR Biomass (upper left), AVIRIS-NG Total Suspended Solids (lower left), and AVIRIS-NG Surface Reflectance (right).
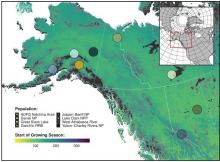
Spatial distribution of eight wolf study populations used in an assessment (from 2000-2017) of denning phenology in response to climate signals. The base map shows the day of the year representing the NDVI-derived start of the growing season in 2010.
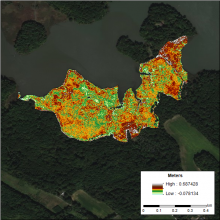
DEM of the Global Change Research Wetland (GCReW) site generated using the LEAN (LiDAR Elevation Correction with NDVI) method. LEAN uses ground measurements of elevation and NDVI in a multivariate linear regression model to estimate vertical bias.
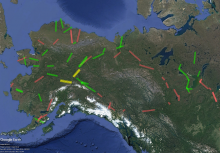
Sites in Version 2 of the Permafrost Dynamics Observatory Project product. Green = data delivered in Version 2. Red = not delivered in Version 2 but will be delivered in future version. Yellow = not processed due to only L-band data being available.
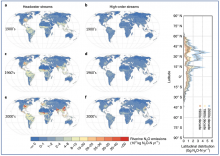
Riverine N2O emission estimates from headwater streams (a, c, and e) and high-order rivers (b, d, and f) for the 1900s, 1960s, and 2000s. The right panel shows the latitudinal distribution of riverine N2O emissions with the uncertainty range as the standard deviation (shaded areas).
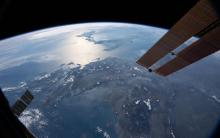
Data from the GEDI instrument on the International Space Station can help answer questions about Earth’s biomes and ecosystem impacts on the carbon cycle and climate. Credit: NASA

Introduction to Population Grids and their Integration with Remote Sensing Data for Sustainable Development and Disaster Mgmt. Two -part series, March 30 and April 6, 2021.
The North American Carbon Program (NACP) is a multidisciplinary research program designed to improve understanding of North America's carbon sources, sinks, and stocks.
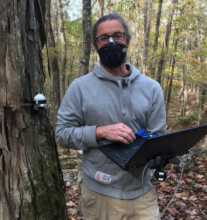
Dr. Anthony Walker installing an automated dendrometer on a Shagbark Hickory at ORNL. These devices take high frequency measurements of stem shrink and swell, providing data on wood growth and water transport through the tree. Credit: Dr. Jeff Warren.
Logo of the Ecological Forecasting Initiative.