Body
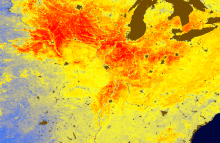
Daymet derived annual average of daily minimum temperature, 1980 (left) and 2019 (right), for a subset of North America. Images are scaled from -20 to +20 degrees C.

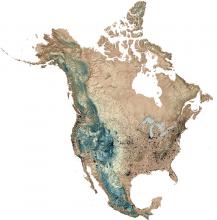
Each black dot on this digital elevation map (DEM) represents a surface weather station in continental North America providing Daymet data in 2010. Additional stations providing Daymet data are located in Puerto Rico and Hawaii.
Daymet derived annual average of daily minimum temperature, 1980 (left) and 2019 (right), for a subset of North America. Images are scaled from -20 to +20 degrees C.
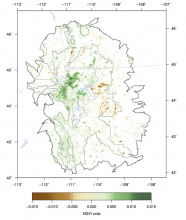
Trends in maximum annual NDVI for natural vegetation within the Greater Yellowstone Ecosystem (GYE) from 1989 to 2014 (Emmett et al. 2019).
Daymet and North American Carbon Program (NACP) data were used to study Normalized Difference Vegetation Index (NDVI) trends across the Greater Yellowstone Ecosystem.

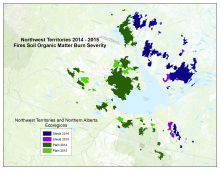
Study area included sites burned in 2014 and 2015 in the southeastern portion of the Northwest Territories and northern Alberta of Canada. The study area includes all 2014 and 2015 fires within a radius of approximately 300 km from Great Slave Lake.
Pre- and post-fire Landsat images were used to classify burn severity of soil organic matter across portions of arctic Canada.

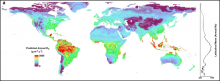
A global map of predicted annual soil respiration (Rs) at 1 km spatial resolution created by applying the QRF model to gridded covariates. Right is a plot of the latitudinal mean predicted annual Rs.
A machine learning approach was used to derive the predicted annual soil respiration and uncertainty at a 1 km spatial resolution.

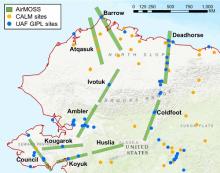
AirMOSS radar swaths flown in 2014 and 2015 in Alaska. In situ soil moisture and temperature profile measurements were obtained at the CALM (Circumpolar Active Layer Monitoring) and the UAF GIPL (Geophysical Institute Permafrost Laboratory, University of Alaska Fairbanks) sites and used to validate AirMOSS data products.
Airborne Microwave Observatory of Subcanopy and Subsurface (AirMOSS) radar data from Alaska are used to derive estimates of active layer thickness. Data from flights in 2014 and 2015 are now available.

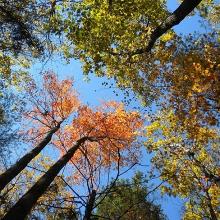
Upward-facing photo of the canopy at Harvard Forest (transect 2, plot 57) on 2012-10-18.
Ground-based data collected at the Harvard Forest site was used to validate Airborne Microwave Observatory of Subcanopy and Subsurface (AirMOSS) soil moisture estimates.

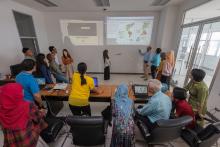
Dr. Don McNeil and his students analyzing data in the classroom. The projected wall image on the left shows the result of a MODIS data subset using the ORNL DAAC's Global Subsets Tool. The projected wall image on the right shows thematic maps of daily land surface temperature increase in North and South America and Antarctica using a laterally rotated Mollweide Earth projection. Image courtesy of Dr. McNeil.
Dr. Don McNeil and students at Prince of Songkla University in Thailand use NASA Earth observing data to study environmental change.

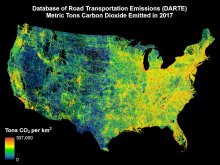
Map of DARTE on-road CO2 emissions for the conterminous United States for the year 2017.
The updated DARTE dataset provides high-resolution, annual, on-road CO2 emissions for the conterminous United States.

Predicted spatially contiguous solar-induced chlorophyll fluorescence (SIF) across the United States for August 1 - 16, 2015. Areas of high SIF are in red, and areas of low SIF are in blue. Agricultural areas, like the U.S. Midwestern corn belt, often have a high rate of photosynthetic production which results in high SIF.
High-resolution, global, estimates of SIF based on data from the OCO-2 satellite serve as a proxy for rates of terrestrial photosynthesis.
 across the United States")
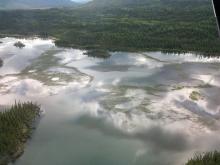
This photo from June 2016 shows the 'extreme' growth of lake grass in a lake near the Tok Community, Alaska.
ABoVE researchers worked with rural communities to document environmental changes that affect access to subsistence resources.
