Body
Daymet Version 4 daily data released on a monthly cycle as 1-km gridded estimates of daily weather variables.

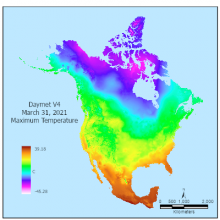
Daymet V4 maximum daily temperature shown for March 31, 2021.
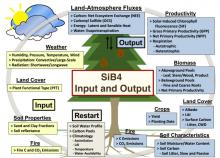
Overview of the Simple Biosphere Model (SiB4) that estimates carbon fluxes among the atmosphere, vegetation, and soils. Input information is shown in yellow boxes. These datasets include a selection of the output variables (blue boxes). Source: Haynes et al. (2020)
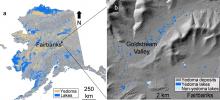
Location of the study area northwest of Fairbanks, AK, USA. The map shows (a) yedoma permafrost distribution and (b) yedoma lakes and terrain of the Goldstream Valley. Data sources include Strauss et al. (2016), Alaska LiDAR Dataset (USGS, 2018), Elevation Datasets of Alaska (DGGS Staff, 2013), and Walter Anthony et al. (2020).
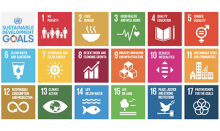
17 Goals of the 2030 Sustainable Development Goals of the United Nations.
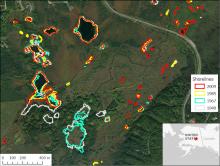
Shorelines of lakes northwest of Fairbanks, AK, over a 60 year period mapped from aerial photographs and satellite imagery. Notice the shoreline shift.
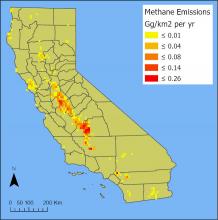
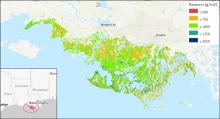
Total annual methane emissions in 2019 from dairy farms in California. These values represent the sum of emissions from enteric fermentation and manure management practices. Units are Gg per square kilometer per year. Source: total_CH4_CA_2019.tif
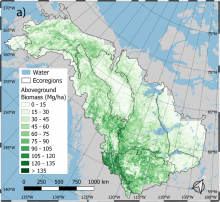
Spatial distribution of predicted aboveground biomass (AGB) density averaged over 1984-2014 for the ABoVE Core Study Domain. Ecoregions represent the EPA Level 2 Ecoregion boundaries. Source: Wang et al. (2021)
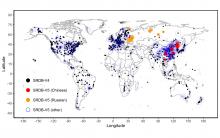
Locations of SRDB V5 observations combining pre-existing observations from V4 and new observations from Russian and Chinese literature, and literature from other languages (primarily English). Circle size represents sample size at each location.
An area of the Mississippi River Delta (Terrebonne and St. Mary Parishes, LA, USA) showing the largest present-day amount of tidal vegetation biomass in the conterminous US. (Source Louisiana_biomass_2015.tif).
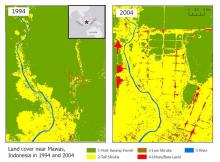
Land cover maps at 30 m resolution across Mawas, Central Kalimantan, Indonesia in 1994 (left) and 2004 (right).